Logs
Gunbot logs contain most of the information it works with. This article provides an overview of the different sections in these logs, and explains how to read them.
This article applies to all strategies except Emotionless, which has intentionally limited log output.
Log files per trading pair are automatically saved in the /gunbot_logs folder and automatically rotated to zipped backups after reaching a filesize of 25MB. Up to three backup logfiles are kept per trading pair.
Trailing
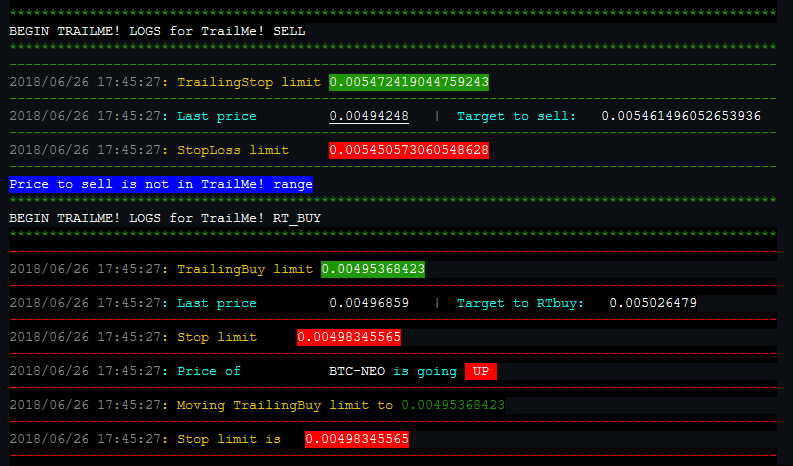
When you are using a strategy that contains trailing, a few sections of a log cycle contain all information related to trailing.
Log entries for TrailMe trailing and TSSL look almost identical and follow the same logic, only the starting points for trailing are different.

Buy trailing
Entry
Description
TrailingBuy limit
The lower limit for trailing, as defined by the set buy range. This value is updated every cycle, following price movement for Last price.
Last price
Current lowest ask price.
Target to buy
Starting point for buy trailing, a percentage from the lowest EMA as defined with BUY_LEVEL.
Stop limit
The upper limit for trailing, as defined by the set buy range. This value is updated every cycle, following price movement for Last price.
A buy order will occur when Last price crosses up Stop limit and is below the lowest EMA.
When the logs state that the price is in range, that means the current price is between Stop limit and TrailingBuy limit.
Sell trailing
Entry
Description
TrailingStop limit
The upper limit for trailing, as defined by the set sell range. This value is updated every cycle, following price movement for Last price.
Last price
Current highest bid price.
Target to sell
Starting point for sell trailing, a percentage from the averaged bought price as defined with GAIN.
StopLoss limit
The lower limit for trailing, as defined by the set sell range. This value is updated every cycle, following price movement for Last price.
A sell order will occur when Last price crosses down StopLoss limit after it was in range and respects GAIN.
When the logs state that the price is in range, that means the current price is between StopLoss limit and TrailingStop limit.
If you've set TSSL_TARGET_ONLY to false, sell orders would also be placed without respecting GAIN. This can only be used for TSSL, not for TrailMe
The "grid"
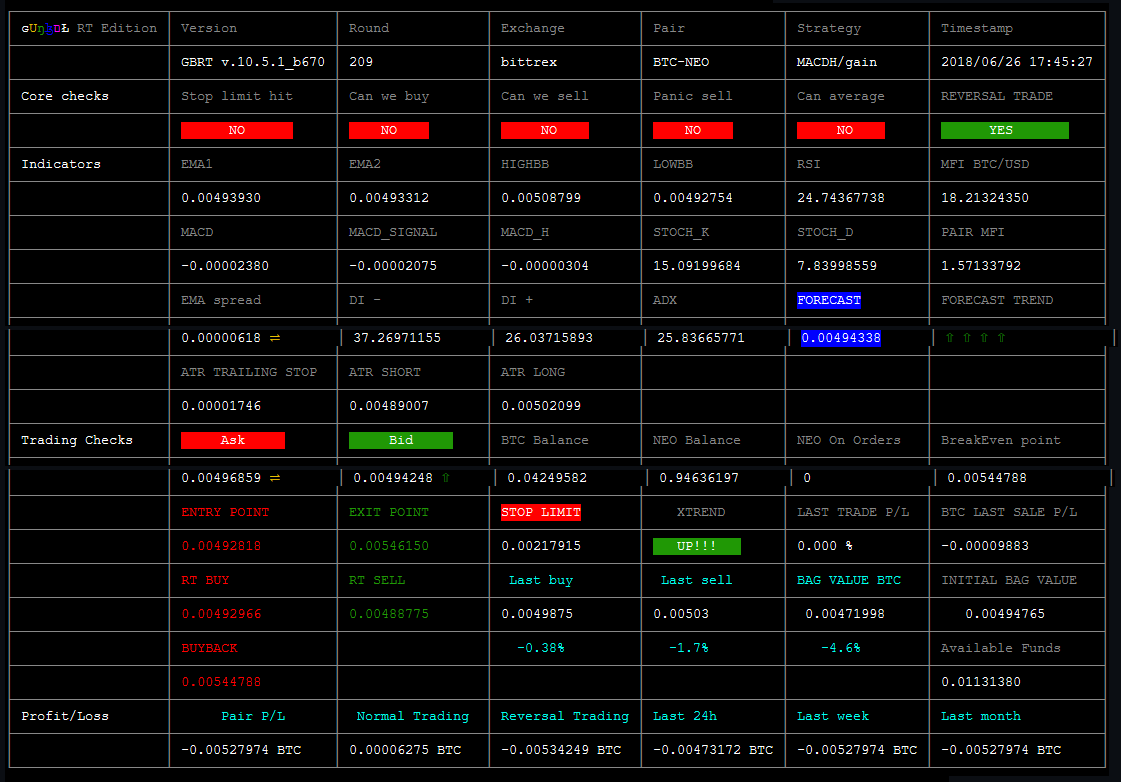
The so called grid area contains all information about core checks, indicators and trading checks. This section should always show for cycles processed correctly (except for emotionless, no grid is shown for this strategy).

Core checks
Entry
Description
Stop limit hit
Indicates if current prices hit or exceeded the set STOP_LIMIT.
Can we buy
Shows YES when you don't own quote currency and market conditions meet one or more of the strategy buying criteria.
Can we sell
Shows YES when you own quote currency and market conditions meet one or more of the strategy selling criteria.
Panic sell
Indicates if PANIC_SELL is enabled or not.
Can average
When DOUBLE_UP is enabled, this shows YES when doubling up is possible according to DU_METHOD and DU_CAP_COUNT.
REVERSAL TRADE
Indicated if a pair is in reversal trading. Shows YES when REVERSAL_TRADING is enabled and an RT_BUY has been performed and no buyback order took place yet.
Indicators
The indicators section shows all indicators as calculated by Gunbot.
Trading checks
Entry
Description
Ask
Current lowest ask price.
Bid
Current highest bid price.
Base Balance
Total available balance of base currency.
Quote Balance
Total available balance of quote currency.
Quote On Orders
Amount of quote currency currently in open orders.
BreakEven point
The break-even point, including trading fees paid.
ENTRY POINT
The price to buy, according to your strategy settings. For example with a pure Bollinger Bands strategy, you'd see a price x% above the lower Bollinger Band. For strategies without a clear entry point, for example when additional confirming indicators are used, the price to buy according to BUY_LEVEL is shown here.
EXIT POINT
The price to sell, according to your strategy settings. For example with a pure Bollinger Bands strategy, you'd see a price x% below the upper Bollinger Band. For strategies without a clear exit point, for example when additional confirming indicators are used, the price to sell according to GAIN is shown here.
RT BUY
The price to buy for the next RT_BUY. When trailing is enabled this price is the starting point for trailing.
RT SELL
The price to buy for the next RT_SELL. When trailing is enabled this price is the starting point for trailing.
BUYBACK
The break-even point where reversal trading will buy back a bag to continue regular trading.
STOP LIMIT
The stop limit calculated as average bought price minus STOP_LIMIT.
XTREND
Shows the trend as measured by XTREND. Only used for Stepgain.
BAG VALUE IN BASE
Shows the value of your "bag" in base currency. It can happen that this value does not disappear after a sell order, this does not matter and it will be updated after the next buy order.
LAST TRADE P/L
Percentage of profit or loss of the last strategy sell order.
BASE LAST TRADE P/L
Absolute profit or loss of the last strategy sell order.
Profit/Loss
This section shows accurate profit/loss statistics per trading pair. Fees are already deducted.
All trades fetched from the exchange are analysed, using IGNORE_TRADES_BEFORE can cause that only trades from a certain time and date are fetched and analysed.
Entry
Description
Pair P/L
The sum of all proceeds for a pair (buy orders have negative proceeds). Only realized P/L.
Normal Trading
Profit/Loss for all trades except trades made during reversal trading. Buy orders without a sell order following are counted as unrealized profit, the full sum of the buy order is considered a loss.
Reversal Trading
Profiti/Loss for trades made during reversal trading only. Buy orders without a sell order following are counted as unrealized profit, the full sum of the buy order is considered a loss.
Last 24h
Same as Pair P/L, but filtered for trades made in the last 24 hours. Note that this can be wrong when multiple buy orders happened before selling and one or more of these fall outside the filtered time frame.
Last week
Same as Pair P/L, but filtered for trades made in the last 7 days. Note that this can be wrong when multiple buy orders happened before selling and one or more of these fall outside the filtered time frame.
Last month
Same as Pair P/L, but filtered for trades made in the last 30 days. Note that this can be wrong when multiple buy orders happened before selling and one or more of these fall outside the filtered time frame.
Last updated
Was this helpful?